

September 2026
Version 3 was about how you build, deploy, and install an NLP++ analyzer — compiling to native code in one click, building in the cloud, installing from npm or pip. Version 4 is about something you do far more often than shipping: understanding what your analyzer just did.
For its whole life, NLP++ has been glass-box natural-language processing — rule-based, explainable, and deterministic: the same input yields the same output, every time, with rules a human can read and audit. That argument always had a gap in it, and it is worth naming honestly. You could read the rules. You could read the result. But you could not watch the decision being made. The only window into a run was a parse-tree dump on disk, read after the fact, from which you inferred backwards what must have happened.
Version 4 closes that gap. You can now set a breakpoint, run your analyzer, stop on the exact rule or the exact line, and look at what the engine is holding at that moment.
The glass box now has a door.
A real debugger, in the editor you already use
Press F5 in the VisualText extension and your analyzer runs under a debugger. Not a log, not a dump — a debugger, with everything that word normally implies:
- Breakpoints on a rule, or on a line of imperative code inside an
@POST,@CODEor@DECL. - Stepping — over, into, out.
- Variables — every NLP++ kind:
G()globals,L()locals,S()suggested,X()context, andN()matched elements, read at the moment you stopped. - A call stack that names each function and opens at the line its call was written on.
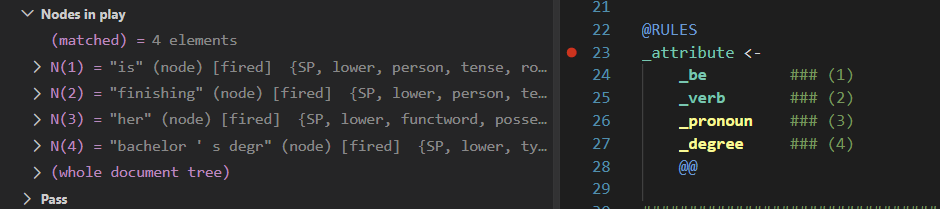
- The nodes the rule is actually about, rather than the whole document tree.
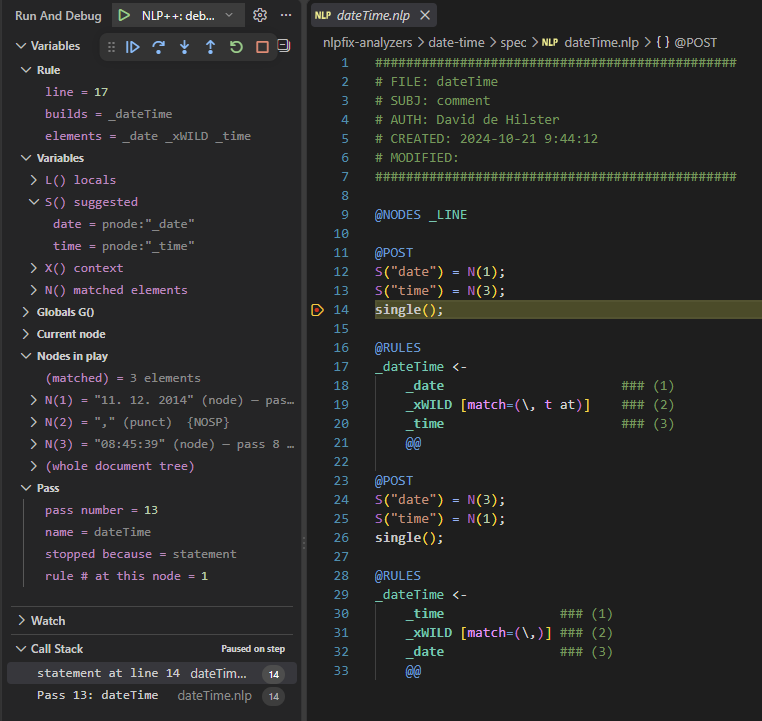
A rule that failed tells you how far it got before it stopped agreeing with the text — which is usually the entire question you were asking. And a rule that never fired at all says so, instead of leaving you staring at a breakpoint that silently never hits.
Two debuggers, and why they were not merged
There are two modes, and the difference between them is real rather than cosmetic.
Replay steps the per-pass parse trees a finished run already wrote to disk. Because the whole run is recorded rather than generated as you go, moving backwards costs nothing — Step Back and reverse-continue both work, so you can walk a node’s history in either direction instead of re-running the analyzer to get back where you were. Its granularity is the pass.
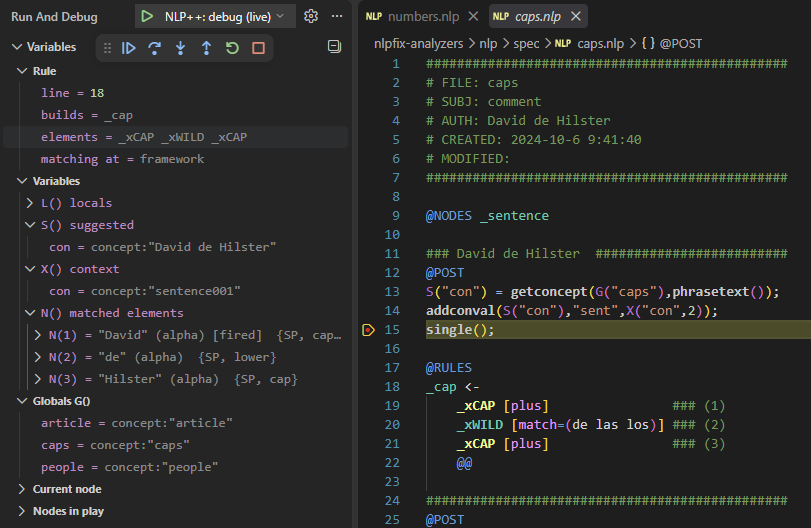
Live drives a real nlp process stopped inside its rule-matching loop. It can stop between individual rule attempts and show you a partial match — but it is forward-only, because an engine cannot un-run.
These could have been welded into one session with a config flag. They weren’t, deliberately: a single debugger that silently lost Step Back depending on a setting would be worse than two that each tell you what they are.
Stepping through NLP++ code, including into functions
@POST, @CODE and @DECL are ordinary imperative code, and Version 4 steps them line by line. A stop is reported before the line runs — which is the point, because the variables you read beside it are the state that line is about to act on, not its result.
Step Into enters a function call. The stop lands in the file the function was written in, not the caller’s, its parameters read back as L() locals, and the globals it changes update as you step:
line 23   depth 1     L(): by = 10      G(): runs = 1
line 24   depth 1                       G(): runs = 11
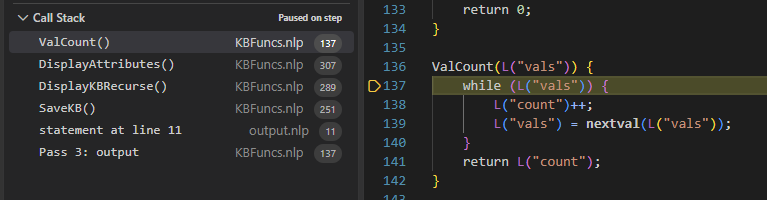
The same three buttons mean different things depending on where you are, because an analyzer has two kinds of execution in it:
| at a rule | in a statement body | |
|---|---|---|
| Step Over | next rule tried | next statement, calls run whole |
| Step Into | next rule that matched | next statement, entering a call |
| Step Out | next pass | until this function returns |
What it took: a debug server inside the engine
None of this is scraped from output. The engine gained a small, documented protocol — start it with nlp -DEBUG <port> and it speaks newline-delimited JSON over a loopback socket. It runs until it reaches a pause point, sends a stopped event, and blocks reading commands until one of them resumes it.
Two decisions in there are worth surfacing, because they are the sort of thing that decides whether a feature like this is usable or merely present.
It costs nothing when off. Every hook is an inline test of one static boolean. An engine nobody is debugging pays for a branch.
It is armed only for the analysis. Before the engine analyses anything it parses its own grammar with the same rule-matching code. An un-armed build stops hundreds of times on rules nobody wrote. That arming is asserted in the regression suite, because it is exactly the kind of property a later optimisation quietly removes.
And the engine is asked what it can do rather than having its version string interpreted:
{"command":"capabilities"}
  -> {"ok":true,"capabilities":["statements","variables","nodeText","callStack"]}
A client pairs with whatever engine a user happens to have installed. A breakpoint is set long before anything could be tried and found missing, and a breakpoint that is accepted and then never fires is the worst outcome available — so when the engine turns out to be older, the breakpoint is withdrawn out loud with the reason.
A language server, so NLP++ is not only a VS Code language
Alongside the debugger, every language feature moved out of the extension and into a separate process speaking the Language Server Protocol: outline, hover, go-to-definition, find references, rename, completion, signature help, folding, semantic highlighting, quick fixes, structural diagnostics and formatting.
For a VS Code user nothing changed — the same analysis produces the same answers. Two things did change underneath. Those features no longer compete with the tree views and analyzer commands for the extension host. And any editor that speaks LSP can now run them: point a client at dist/server.js.
The move added no duplicate logic, because the analysis engines never depended on VS Code in the first place. The build enforces that: the server compiles under a Node-only configuration, where an accidental editor import fails the build rather than shipping.
The unglamorous half: finding out it was wrong
The honest part of this story is what happened when the debugger met a real analyzer for the first time.
Six bugs surfaced within hours. Every one was silent — nothing threw, nothing errored. The debugger simply told a slightly wrong story, which is the worst failure mode a debugging tool has:
- A block holding exactly one statement never stopped. Two statements in a body worked; one did not — and a single-statement
ifbody is much the commonest shape in NLP++. The same flaw hitif,elseandwhilealike. - A
whileloop’s condition was reported once and never again, so stepping went from the bottom of the body straight back to its top, as though the loop had no test in it. - An
iftook its line number from its body, so with the body on the next line the test never appeared at all. - Starting the debugger opened on a tokenizer built into the engine, with every pane empty, because nothing the user had written had run yet.
- Starting with a breakpoint set stopped somewhere else first — which looks exactly like a breakpoint being ignored.
- And the call stack said “4 calls deep” while listing nothing at all.
All six are fixed. More usefully: the layer where they lived had no tests, and CI was not running the debugger tests that did exist. Both are addressed — and the suites were checked the way a test suite has to be checked, by putting each shipped bug back and confirming the tests catch it.
Why this is the version that matters
Version 3 made a deterministic engine fast and easy to ship. Version 4 makes it inspectable while it runs.
That is not a convenience feature. The case for glass-box NLP has always been that in critical-path systems — where “usually correct” is not good enough — you need to prove why a decision was made. Proving it by reading rules and inferring backwards from a dump is a very different proposition from stopping on the line, looking at the variables, and reading the call stack that led there.
Deterministic systems have always been auditable in principle. Now they are auditable in practice.
Built with an AI collaborator
As with Version 3, much of this was developed in collaboration with Claude (Anthropic’s Claude Code) — visible in the commit history, including the six bug fixes above, each found by a person using the thing and fixed with a regression test that was verified to catch it.
The symmetry Version 3 noted gets sharper here. A large language model helped build the tooling that makes a deterministic system auditable in motion. The LLM is the development partner; the runtime stays transparent and reproducible.
You could always read the rules. Now you can watch them run.
